A better economic model ... the solution
We need to expand our model to
include and measure the good things we want (beyond money) and
avoid the bad things that can happen (even if we have money).
What we need is a healthy, reliable, and measurable standard on which to base our economic aspirations and, in doing so, remove the inevitable instability of basing our quality of life on "growth".
Instead of growth, we should base our economic expectations directly on quality of life: develop a model that pays us when we do things to improve our quality of life (QofL), and penalizes us when we do things to lower our quality of life.
We need to:
- Rough out the new economy model by identifying its components and defining how those components interact.
- Define and measure our quality of life.
- Identify and measure our needs.
- Identify and measure the resources that we can use to meet our needs and thus improve our quality of life.
- Pursue activities that use resources to meet needs and therefore change our QofL.
- Based on initial ideal measurements, realistically balance needs/activities/resources and expectations.
- Audit the past.
- Use money as a resource and a motivation.
In the West we used to have a gold standard. Then, starting somewhere early in the 20th century, we migrated to a "money standard" based loosely on the U.S. dollar. Basing our worth on such a fluctuating foundation meant that the marketplace - that is, the stock exchanges - control our financial security! Like trying to cross a rushing stream in an Indiana Jones movie. Let's move beyond this asap: gold standard -> money standard -> life standard.
The objective of this new model is to establish a system of measurement based on QofL that:
- Cannot be twisted to make it seem like it's benefiting all of us but in reality is benefiting only a few.
- Will not accidentally produce parameters that seem positive but are, in fact, negative.
- Will show the effect on QofL in a way that is proportional. For example, a small change in a needs score should result in a small change in the overall QofL score for all needs.
Rough out an economic model
I've chosen to model the economy by interrelating the concepts of quality of life, needs, resources, and activities:
- A need is something that we lack and need to acquire. We can have one or more needs individually or as a group. Because a group of people also occupy an area of land, we can identify our need(s) per individual, per group, or per area of land. The degree to which we are able to reduce our needs improves our QofL.
- A resource is something that usually an area of land, or occasionally an individual or group of people, can provide. The concept of a resource only becomes necessary when that resource is required in order to lessen a need.
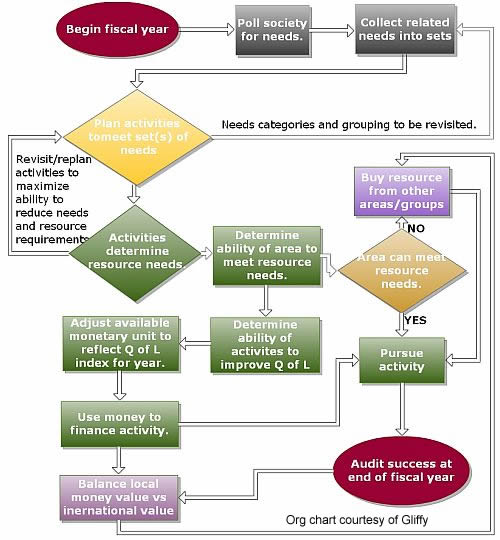
Steps in a proposed economic cycle
The economic process continues over time. Initially, let's say at the beginning of each "fiscal" year, a society plans out activities with the objective of reducing the needs of its population. During the year, the activities can also interact and change to accommodate resource requirements and new needs as they are discovered; as a result, more activities will inevitably surface. The success of these activities and changes determines the economic success or failure of that fiscal period, based on the hopefully positive change in the measure of quality of life of the society.
Planning
- Start the fiscal cycle. Determine a fiscal period time cycle and a date when that cycle is to begin. For example, this can be done on a yearly basis, or every 4 years to correspond with an election cycle.
- Identify our needs for the moment. These are personal needs that we have as individuals or groups.
- Collect related needs together into a set. This prepares an approach where related activities that may require similar resources can be grouped into projects.
- Create an activity, or a project (series of activities), that aims to reduce a group of related needs. Note that the exercise of creating an activity may result in rethinking the needs iteratively until we are satisfied with the project's ability to reduce a set of realistic and resolvable needs.

Repeat steps 2-4 until satisfied.
- Determine the resources required by the activities:
- To help this process, we can use our long history of economic activities to predefine many resources. We know from experience that certain resources will frequently be called upon by most or many activities; for example, energy, minerals, water, air, fertilizer, chemicals, oil, ... We can predetermine whether and to what degree an area (or group of people) can provide such resources. Although resources do not come into play until activities have been planned that require such resources, having already identified and determined resource capacity can save time when planning activities. Note that prejudging resources can also impact on what activities are planned and how they are planned.
- Optimize the project activities to improve their ability to reduce personal needs and resource requirements:
- May discover additional needs that would not be there initially but could arise as a result of pursuing the activity; for example, an activity that pollutes would create a need for better air quality.
- Intentionally or unintentionally may produce products that can become, or are deliberately planned as future resources required by the other projects and activities.
It is important to maximize the degree to which an activity reduces personal needs and minimize the resource requirements of the activity.
Repeat steps 2-6 until satisfied.
- Determine the ability for an area or group of people to satisfy the resource requirements. This ability cannot be completely determined until all activities for the initial set of needs have been at least planned. Then additional activities can be planned that increase the ability of an area (or group of people) to supply such resources (to discover additional resources where none had been anticipated, to make it simpler to access resources, to restructure activities to use less/fewer resources, or to make it easier to acquire resources from other areas). In this way, planning high-level activities can result in the spin-off of having to plan resource-gathering activities.
- (If the activity can be totally resourced from within the area/group, then skip this step.) Plan to acquire resources whose requirements the area/group cannot fully meet from other areas/groups:
- Because such resources are controlled by factors outside the control of the local area/group, fewer resource-related attributes may need to be considered when acquiring such resources from outside the local area/group.
- The external area(s)/group(s) supplying the resource will need to be compensated for their loss, usually by a generic medium such as money where its value is standardized and accepted by the participating groups. Local and inter-area/group exchange rates need to be established. This new model allows for such monetary standards to be established (probably through a
money value index) once all activities of an area/group have been planned and the potential for those activities to improve QofL established.
- Allocate available resources to each project/activity.
- Discover the QofL and resource requirement indicators for all planned projects/activities. Also gather success/failure historical data and indicators of past and currently ongoing activities.
- Create or adjust the amount of available money. For this fiscal cycle, use the QofL, resource requirement, and historical audit indicators to determine the amount and value of the local currency (money), and its value relative to the money of other societies. Establish these as standards based on the ability of a society to improve its quality of life.
- Add money, as a resource, to the resource requirements for each planned activity.
- Repeat steps 4-12 until all activities can be resourced adequately and therefore pursued.
- If there are not enough resources to satisfy all activities and resource requirements, then the group cannot meet the original needs-based QofL goals. The activities must be revisited to reduce the needs-change expectations.
- If there is not enough money to fund all the activities, then additional funding can come from 3 sources: government, private investor commitments (shares), and adjustment of the monetary unit (as described below).
- Therefore, most likelyl, the initial set of needs expectations will be shrunk until the planned activities are able to meet those expectations.
Following the plan
- Pursue the activities, to the degree and at the rate (time) that the resource requirements can be met.
Auditing the results, and learning from them
- At the end of the fiscal year, audit the results re initial planning and expectations. Within a society, the individuals can learn from this exercise. Relative to other societies, a society can build a reputation for its ability to meet expectations and improve quality of life.
A society that can successfully and consistently improve its qualtiy of life has value and is worth living in and belonging to. A group that has a reputation for good fiscal management provides value that can be used to sway the international exchange rate to benefit the group.
Success of this new model will be based on a more accurate, visible, and easily understood, measurement of the quality of life contribution of each activity or state of being.
What is quality of life?
I see quality of life as "the good feeling". If we all have "the good feeling" in such a way that we can continue to have it, and our descendants can and will also have "the good feeling" from birth to death (and beyond?), then that is the quality of life I am aiming for. That is the global Q of L standard this new economic model should be based on.
The determining factor is to check the source of our "good feeling" to ensure that that source contributes to the global goal. If it doesn't, then that source needs to be questioned and some balance achieved between our personal "good feeling" and the global goal.
A main supposition I'm making is that true quality of life does not happen unless everyone is involved, all 7.xB of us. However, it's probably a no starter to try to begin our model with rules and concepts that englobe everyone in the world - not yet. So I'm thinking we could divide the world into watershed areas, which form physically natural population centers and which are unlikely to change much over the human era. Then we can try to measure the QofL for the people in that area and hope for the best.
Measuring quality of life
It is the concept of quantifying (measuring) our quality of life that is important here, more than the formula and units. I'm proposing one type of measurement, but go ahead and come up with something better. As long as we can measure it, we can work with it.
Scoring
A score would be based per individual or per group of people.
- For a group of people 1) under the umbrella of a specific system, ethnicity, collective goalset, or 2) over a land area being controlled by a system of governance:
Score 0 (lowest) to 5 (highest).
Some ways in which this scoring could be used are:
- (IQL) The QofL score for each individual.
- (AQG) Average QofL score for group: Individual average over the people in the group or area (QofL score per person summed for all people divided by the number of people).
- (TQG) Total QofL score for group: The total of all QofL scores for the group (or average per person (AQG) times the number of people in the group).
Considerations
Ask. Give everyone in the world a periodic referendum on the level they think their quality of life is at. We can mandate the period of that referendum as we wish or can allow. The more frequently or easily we can poll public opinion, the better.
Balance the average so that it isn't skewed: that a few thousand 5s and a few thousand 1s don't average higher than most people scoring 4s; in other words, we don't want a small group of people running the country based on the unhappiness of the rest.
Judge each anticipated change or action on its ability to make a positive change in the quality of life average.
As the effort progresses, test and measure the success of each effort (activity) based on the QofL score average. Build a history that can improve future predictions.
Identify and measure (personal) needs
This is a complex effort, as evidenced by an ongoing neverending effort by eminent experts to classify and categorize needs throughout human history.
I found that I had to distinguish between 1) an ongoing or personal need like air to breathe and food to eat, and 2) an activity-generated need like iron to use or fuel for a fire. Because the second type of need only arises from an activity - I'm calling this second type of need a "resource" and describe its attributes and QofL score impact under "Identifying and measuring resource requirements" (below).
Types of needs
To start us off, there are:
- Abstract (personal) needs (stability, happiness, health, ability to see/sense, satisfaction, sleep, security, self-respect, prestige, success, self-actualization, beauty, harmony, spiritual, learning, etc). These are abstract in the sense that they can't easily be quantified into quality and quantity units.
- Physical (personal) needs (air, water, food, social interaction). Each physical need can be broken down into two aspects: quantity needed and quality needed.
Hierarchy of needs
In order to have an organized approach, we can put the needs into a hierarchy of assumed importance. That way we can start with trying to satisfy the "more important" needs first.
- High importance:
- Air for breathing (quality and quantity).
- Water for consumption (quality and quantity).
- Food (category, quality, and quantity).
- Physical comfort (warmth when cool; coolness when too warm).
- Medium importance:
- Health. There are certain sub-needs that we know from experience affect health; for example, sanitation.
- Good balance between social interaction and privacy.
- Challenges, to the degree we require them.
- Gratification of the senses, to the degree we require them.
- Don't know yet:
- Rest/relaxation (hours).
- Social interaction (hours, quality).
- Education (level).
- Ability to progress towards meeting aspirations.
- Security. Enough stability in that our environment and society so that changes keep pace with our ability to understand them. So that we can work with what we have, and do what we want and need to do. No earthquakes, tornados, wars, environmental disasters.
Note that many needs are interrelated with other needs. When establishing a formula, those interrelationships should be taken into consideration, or the needs redefined to minimize overlap.
General attributes
Each need can be measured as to its: quantity and quality.
Measuring needs
In order to measure needs fairly, any measurement system can and will get increasingly complex. However, to start things off and keep things initially simple...
Scoring
A score would be based per individual or per group of people. Also, each person will have multiple needs, and therefore more than one needs score:
- Abstract need - uncertainty of the measureable attributes of the need; for example, love, self-respect, guidance:
Score 0 (need is met) to 5 (need is most pressing).
Physical need - for a quantity of something:
Score 0 (need is met) to 5 (need is not met because there is too little or too much of the resource available that would satisfy the need).
Physical need - for a level of quality of something:
Score 0 (quality is poorest) to 5 (quality is best).
Some ways in which this scoring could be used are:
Relate needs to QofL
Needs score is inversely proportional to the QofL score:
Considerations
Some needs, such as air, water, etc., can be predicted and assigned; other needs, such as those involving aspirations, challenges, etc., will need to be communicated back from the people to the central economic model (polls, referendums, statistics).
A main need related to quality of life may well be
stability. The gold standard, which the west has had for many centuries
preceding our current era, addressed this need rather well. A country strove to
accumulate as much gold as possible and then issued money as a representative
symbol of how much gold the nation had. International exchange between
different monetary units was then measured by comparing the quantity of gold
each nation had in storage. How more stable can you get?
The concept of stability is important mainly in that
instability can seriously and quickly degrade quality of life. Hence lets
avoid it strongly. Which is why, in countries with dense populations, the need for stability frequently trumps
human rights.
QofL is proportional to the degree to which needs are met, or a decrease in the needs score over time.
Identify and measure resource requirements
As for needs, identifying, classifying, and measuring resources is not a simple task. This section starts the classification process by identifying some types of resources and certain key resources.
What is a resource?
We are surrounded by everything, and anything and everything can be classified as a resource. However, we only need to focus on something specific - as a resource - if we become aware that that item can be used to partly or completely satisfy one or more needs through an activity (as described under "Activities and states of being" (below)). Therefore, before we can start to identify and classify resources, we need to have planned out our activities.
Types of resources
For this model, in order to keep things simple, I'm lumping everything that can be used - as a "resource".
- Natural resources:
- Air (quality and availability).
- Water (quality and availability).
- Food (calories and other units of measure related to body health).
- Natural assets (trees, forests, waterfalls, seascapes, ..).
- Minerals.
- Manufactured goods:
- Transportation infrastructure.
- Clothing.
- Educational institutions.
- People-resources:
- Availability to do work (hours, energy).
- The number of friends and family.
- Certain demographics, such as the collective aspirations, opportunities, limitations of different groups of people.
- Ease with which a person can influence others (charisma?).
- Other:
- Proximity of demand to supply = market potential.
- Assets, including visual assets, other sensory assets (nice views, etc.).
- Money (value and quantity to be determined after all activities have at least been planned) as described under "Creating a stable currency (money)" (below).
Most common resources
For reasons to be shown under "Activities" below, the most commonly required resources are:
- Transportation infrastructure to move things and people around because most activities involve the repositioning of things (and people) so that they recoalesce into other things that will be useful in meeting needs.
- Energy, which is required for the movement of things.
- Person-resources (drive, intelligence, energy, interaction, leadership, communication, charisma, ...) because most activities will involve and require people doing things.
- Money as described below.
General attributes
Each resource can be judged as to its: availability, quality, and renewability. Renewability can also be considered as two items: separately for the 1) quantity and 2) quality. Renewability can be either a natural process (controlled by Mother Nature) or artificial (renewed by man).
Availability is the amount of the resource per area/group of individuals. Availability can also be of two types: natural availability (naturally occurring) and artificial availability (meaning products/resources created by other activities).
Note that resources are not directly linked to QofL. They impact on the activity and on the ability of the activity to satisfy needs and thus to raise the QofL score. A resource becomes an issue only in the context of an activity (business venture, personal goal), or a state of being (simply being alive requires resources as well) that requires a resource.
Determining the overall ability of an area to supply a resource
Once all activities have been planned and resource requirements established, those resources are known and the requirement can be scored over planned activities. Then the availability, quality, and renewability of each resource can be determined for the whole area and the available resources distributed among the planned project activities:
- The area can satisfy that requirement completely. The activity can be pursued within the envelope of a group of people or area of land under the same fiscal governance.
- The area does not have enough (or maybe none) of that resource to satisfy the requirement. Then the activity can only be pursued if the sourcing fiscal governance (group/area) can acquire the addition resources from groups/areas outside itself. For such an acquisition to happen, an agreed-upon symbol of value,
money, needs to be created and then used to facilitate exchange. Participating groups/areas need a shared understanding (a standard) of the relative value of the monetary units each creates for itself.
Measuring resources
Like for needs, measurement of resourcing is also quite complex and efforts to do so ongoing throughout history. Again, to keep things simple:
Process
- Determine the conventional units used to measure the available resource attributes (liters, meters, grams, volume units, etc.). For example, air may be measured in cubic meters; arable land in square kilometers; transportation in its ability to move x people y distance in z minutes. Note that renewability may be expressed as a percentage of what is used up compared to what was there before being used. Note also that Mother Nature may automatically renew a resource in part, meaning that the renewability attribute is based on the ability of the area/group/activity to renew only the remaining percentage.
- Based on what is required by the planned projects/activities for the group/area, determine the total quantity, quality, and acceptable renewability values required. These values may not be the same throughout the area and, for simplicity, may need to be averaged to get a single value that can be more easily used in caculations.
- To get a base availability for each project, allocate the available resources among the planned projects - how much of the total available/quality/renewabilities are to be made available to each project (see table under "Activities" (below).
- For each project activity and resource attribute, divide the available amount by the required amount to get a value from 0 to 1. Then multiply this by 5 to get the 0 (resource not available) to 5 (exact amount of resource available) score used for this economic model.
- Depending on the degree to which the project planners (group/area) are satisfied with distribution and limitations, the planned projects/activities can be adjusted so that they can be better resourced. This exercise also determines whether some resources need to be acquired from outside the group/area.
- Compare what is available to what is required, and measure the scores as shown below.
Scoring 1): if the area can satisfy that requirement completely
- Quantity required:
Score 0 (resource not available for the activity) to 5 (exact amount of resource required by activity is available).
Quality required:
Score 0 (quality is least that required by the activity) to 5 (quality is exactly what the activity requires).
Renewability of quantity required:
Score 0 (quantity of the resource used by an activity is not renewable within a practical time period) to 5 (most of all the resource is renewable within the same time period).
Renewability of quality:
Score 0 (quality of the resource used by an activity is severely degraded by the activity) to 5 (quality of resource stays the same, or bounces back quickly).
Some ways in which this resource requirements scoring could be used are:
- (IRA) Score for a single resource for an activity inside a project:
(quantity + quality + quantity renewability + quality renewability)/4.
Examples:
- required amount of water is available, best quality, completely renewable:
(5 + 5 + 5 + 5)/4 = 5
- required amount is available, poorest quality only, non-renewable:
(quantity 5 + quality 0 + quantity r-ability 0 + quality r-ability 0)/4 = 1.33
- not available, some quality required, not renewable:
(quantity 0 + quality 2.8 + quantity r-ability 0 + quality r-ability 0)/4 ≡ 0
Note that, if the resource is not available, then all other parameters automatically default to 0.
- (IRP) Score for a single resource for a project: For all activities in only one project (IRAs totalled for all project activities divided by number of activities required for project).
- (ARA) Average for all resources for a single activity: For all resources in the activity for a project (IRAs totalled for all project resources divided by number of resources required for project).
- (ARP) Average for all resources for a single project: For all activities in only one project (IRPs totalled for all project resources divided by number of resources required for project; or ARAs totalled for all project activities divided by number of activities for project).
- (IRG) Average for a resource per project for all projects planned for group/area: Measure only one resource (IRPs for selected resource totalled for all projects divided by number of projects).
- (IRA) Average per area unit for a resource for all projects planned for group/area: Measure only one resource (IRG divided by area units; for example, 2.4/1000sqkm = score of 0.0024 attributed to entire area: measures the ability of the area to meet requirements for one resource for planned projects).
- (AARG) Average for all resources over all projects planned for group/area: Average all resources (add ARPs for all projects divided by number of resources; measures ability of area to meet all project resource requirements).
- (IRI) Average per individual over all resources and projects planned for group/area: Obtain a resource average for each person (AARG divided by the number of people in that area).
- (TARG) Total for all resources over all projects planned for group/area: (add ARPs for all projects in area).
Scoring 2): if the area (group of people under the same fiscal governance) can satisfy a resource requirement only in part or perhaps not at all
Note that, if the area agrees to sell a resource to another area, then that sale (or purchase) can considered to be an activity and that activity could be added to the project.
In the case where an activity has a resource requirement where the resource must be obtained from outside the area, the resource quality and quality requirements need to be translated into
money units. Note that the renewablity attributes drop out of the scoring equation. The available quantity of money and the exchange rate based on the
money value index (as described below) determines how much money is available to buy the resource and how much the other group or area is charging for that resource. By allocating money to a project/activity, the area determines how much of the resource requirement the project/activity is able to acquire (pay for).
- Money required for quantity:
Score 0 (no money available - resource not available for the activity) to 5 (amount of monetary units available enable the purchase of the exact amount of resource required by the activity).
Money required for quality:
Score 0 (quality that can be afforded is least that required by the activity) to 5 (quality is exactly what the activity requires).
Some ways in which this scoring could be used are:
- (IRG) Score for a single resource over an area (group):
(availability score + quality score)/2.
Examples:
- enough money is available to buy the required amount of water, best quality:
(5 + 5)/2 = 5
- enough money is available to buy the equired amount is available, poorest quality only:
(availability 5 + quality 0)/2 = 2.5
- money not available to buy resource; some quality required:
(availability 0 + quality N/A)/2 ≡ 0
- The other parameters (expressed as acronyms) are the same as described above.
Considerations
In some cases, change in QofL is inversely proportional to the use of natural, and certain manufactured (= products) resources, in that what is not used remains available to further the goal of increasing the QofL (next time period) through other activities.
In other cases, change in QofL is proportional to the use of certain resources that accumulate over time and where that accumulation beyond certain levels does not have a positive impact. For example, personal energy, sewage, too much water.
Renewability is time-dependent, in that if the amount used can be totally replaced (renewed) in 1,000 years, then it can be considered non-renewable; in 1 year, it may be considered renewable.
Activities and states of being
To improve (i.e., change or even continue to maintain) our quality of life, we need to engage in activities. Simply existing also impacts our QofL in that our existence, and that of everything around us (plants, animals, even inanimate objects) impact on our needs and our resources. I call these "non-active" activities "states of being". Types of activities could be classified into:
- Artificial activities, such as businesses, sports, leisure pursuits, hobbies, etc.
- Natural activities, such rain, earthquakes, storms, ocean currents, erosion.
- States of being: existing as a human, plant, animal, inanimate object. For example, we need to breathe, eat, be kept comfortable. We perceive our surroundings and those perceptions (mix of animate and inanimate) impact on how we feel.
Any activity or state of being involves:
- An area of land or group of people (governance group, those in an area of land, ethnic group, ...).
- The needs the activity attempts to meet: try to reduce the needs score; for example, if the score for a need across an area (
ANG) is 2.5, then the objective of all activities for the area is to reduce that need, ideally from 2.5 to 0.
- New needs created by the activity: try not to create new needs but, if unavoidable, then try to result in the lowest possible needs score. For example: enough water to drink and use is good, but water flooding your basement is not (and results in creating another need); air is good to breathe, but not good as a fuel for a housefire; sewage is a necessary byproduct of a state of being, but not good in quantity.
- Resources required for the activity: less required the better;
- Products (= new resources) created by the activity.
Objective: to meet a set of needs
The following table provides a matrix model of activities vs impact on needs for one project. It's assumed that such a table would apply to an area of land, a group of people, through a period of time. For initial purposes, the table reflects the total timespan of the planned project.
Score 0-5:
| Activity |
Needs modified
(ANG) |
Needs created
(ANG) |
AANG
(ave over ALL needs,
not just those
in this project) |
QofL |
| N1 |
N2 |
Nx |
N3 |
N4 |
Nx |
| At start of project |
n |
n |
... |
n |
n |
... |
n |
n |
| Ability of activity to reduce the needs score |
d(needs score) |
d(QofL score) |
| 1. Activity 1 |
-n |
-n |
... |
-n |
-n |
... |
-x |
+x |
| 2. Activity 2 |
-n |
-n |
... |
-n |
-n |
... |
-y |
+y |
| 3. Activity 3 |
-n |
-n |
... |
| At end of project |
n |
n |
... |
n |
n |
... |
n |
n |
| Needs index (= change in
AANG due to this project) |
-(x+y) |
- |
| QofL index for project |
x+y |
Note that the AANG column represents the average per need per individual averaged for all needs expressed throughout the group/area. For example, if the project only addresses a need for yoyos, blue skies, bridges, and bicycles, but the community throughout the group/area also needs chopsticks and windows, then the average per need would be obtained by dividing by 6, not just 4. This project alone would not be enough to bring the QofL score up to 5.
To judge how far the planned activities will go to improving the QofL (average overall per person score) for the society as a whole (
AQG), you add the needs index (change in AANG) for all planned projects.
The QofL index for each activity is the change in QofL score, or d(QofL score) for that activity.
The QofL index for each project is the change in QofL score, or the sum of d(QofL score)s for each activity in the project.
The sum total of all QofL indexes for all projects planned for that area determines the overall QofL index for the area/society/group.
QofL score for activity: anticipation over time
Whenever there is an issue or an action proposed or taking place, specify all the needs that that effort impacts. Then you can average the value per person and group per time and obtain a QofL index for the activity.
Depending on how you wish to time-slice the activity, each activity has:
- An initial QofL score at start of the activity,
- A predicted score at the end of each agreed-upon time period during the activity,
- The measured score at the end of each such time period,
- A predicted score at the end of the activity.
- The final score at end of the entire activity.
Identifying and using resources
The following table provides a matrix model of activities vs resources. It's assumed that such a table would apply to an area of land, a group of people, through a period of time.
The resource requirement values in the following table are expressed as a score from 0 to 5:
- Of the available resources, each project is given a portion, measured in conventional units. This represents the amount per attribute of the resource allocated to the project.
- Each activity requires a certain amount per attribute in order to successfully accomplish the activity.
- The resource requirements score per resource per activity is the average of the available attribute requirements into a single 0-5 score ((availability + quality + quantity r-ability + quality r-ability)/4).
| Activity |
Resources required
(IRA) |
Money required |
Ave
/activity
(ARA) |
| R1 |
R2 |
Rx |
$ |
| Activity 1 |
n |
n |
... |
n |
ARA |
| Activity 2 |
n |
n |
... |
n |
ARA |
| Activity x |
... |
... |
... |
n |
... |
| Resource requirements score for project |
| Ave/resource
(IRP) |
n |
n |
... |
n |
(ARP) |
Balance needs vs resources vs activities
And I thought initially that this was going to be so simple.
But to look at things realistically, no activity is going to happen without it being completely resourced. All resource scores, and averages, will need to be 5 for an activity to happen, and all activities in a project, and the project itself, will need to score 5s for it to take place. Once the initial planning cycle determines ideal needs/QofL and initial resource requirements, the whole process will have to be revisited, scores adjusted, and expectations matched to reality:
- Resource allocation: This model can give an indication of how close an activity or project can be to succeed, and therefore the initial scores can be useful in determining how to allocate resources and to identify which resources are required where and to which degree. Then, the planners can revisit the needs being aimed for and adjust social expectations re needs and QofL for that planning and fiscal period.
- Funding: Each activity will cost a certain amount of
money at its value as determined at the time of planning (based on the
money value index)). Money is a (and maybe "the") key resource requirement. As described in "Money", below, the initial planning cycle, and social history, determine the ability of that society to fund activities and projects. The gaps between money requirement and the ideal score of 5, will then need to be shrunk and/or activities/projects scaled down or shelved.
Note that the usage of certain resources may increase the needs in those areas and for groups of people, especially if you consider "groups of people" to extend into the future, i.e., our children and the needs of individuals at various stages in their life cycle.
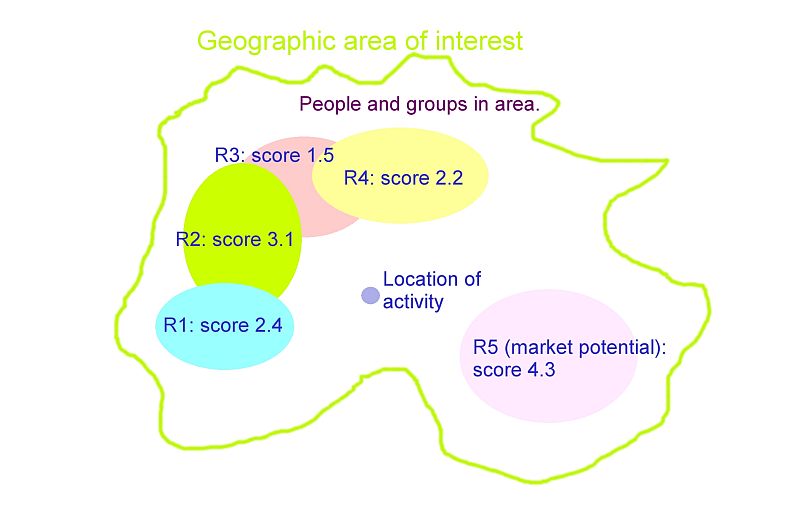
Determining and distributing resources
As an initial step in determining your resources - to visually envisage the way an activity impacts on the resources within a geographical area - you can draw a map that pinpoints the location(s) for a specific activity; then locates and bounds the areas that contain the resources needed for the activity, as illustrated in the figure below.
Money
The last step in the economic cycle is to create a mechanism to measure value and to base that on quality of life for a given society for the fiscal period. We need a stable currency and a transparent marketplace to create confidence necessary for people to be willing to accumulate and use money to represent the assets they wish to acquire and exchange.
Creating a stable currency
A
monetary standard gives the individual and groups of people a unit of measurement (money) that they can use to control their success in striving towards a better quality of life. A stable monetary standard also enables groups to balance and share mutual efforts in improving each other's quality of life.
Stability is of extreme importance when changing the value of the monetary unit. People have to be able to depend on its value in order to be able to plan. Lowering the ability to plan and control one's life lowers the QofL. The bottom line is that any change to the monetary unit must be done in very small increments and with careful communication and transparency. Whatever formula we come up with to link the monetary unit to QofL must not enable it to change the monetary unit in any dramatic way.
The components that can be used to manipulate money
This economic model proposes to use money to improve QofL through the following components and and measurement parameters:
- A money value index, which is a table that relates - let's say a 100 - key items and services to the number of monetary units each would cost. This index records, based on the actual marketplace at a given time, how much value the monetary unit has as perceived by the population.
The money value index is like a reference document. You can use it before and after adjustments to the economy have been implemented to see if the model (its processes, formulas, results) matches expectations. The index can also be used as a communication document between fiscal planners and society.
- The QofL index, based on:
- At the beginning of the fiscal period, the average QofL score per individual across a group (the
AQG, as described above).
- At the beginning of the fiscal period, the planned change in QofL score for all projects planned for the coming fiscal period.
- At the end of the fiscal period, the actual change in QofL score for all projects pursued during the fiscal period (to raise the QofL up to 5, this change is the
AANG, as described above) measured.
- The resource requirements index to reflect the ability of the society to resource, and therefore actually accomplish the QofL-related projects being planned: obtained by 1) averaging the ability of each project to resource the activities in that project (see
ARP above), and 2) again averaging the ARP over all the projects.
- The success index based on the ability of the society to meet planned QofL goals in past fiscal periods: divide the actual by planned AANG to get a value. This value should be close to 1 for successful social fiscal management.
Formula for adjusting the monetary standard
As for other measurements in this model, I'd like to keep the numbers simple, restricting the range between 0 and 5.
QofL index
The QofL index is the planned change to the QofL score for the group for all projects planned for the group. The index is the total of all d(QofL) scores for each planned project. Each project contributes a bit more to the overall (hopefully positive) change to the QofL score; therefore the total of all d(QofL) scores for all projects represents the planned increase (or decrease) in QofL score for the group. If the group has planned projects to meet all the required needs of the group; then this QofL change score equals the
AANG (as described above).
Resource requirements index
The resource requirements index is the average resource requirements score per project
ARP, averaged over all planned projects for the group:
Success index
I'm proposing to measure success by keeping track of planned and achieved in QofL score (AQG, as described above) at the end of each fiscal period, say over 10 years, in the following ways:
If the success index is equal to or more than 1, then the society/group is adept at creating effective projects and activities to improve its QofL. If the index is less than 1, then the society/group needs to improve its performance.
If the trend is positive (greater than 1), then the society is gradually improving its planning ability over time. Less than 1 indicates that the society is becoming less able to plan well.
Performance index
To include the above parameters into a 0-5 scale:
Monetary standard change factor
Based on the factors described below, try out the following formula to determine how much to reduce or increase the monetary standard:
Creating a currency
To start off a new currency system, for example:
- At beginning of the year being budgeted: total population times ave QofL score (AQG) (as described above). For example, 35,000,000 people x 3.2.
- Do the same for the anticipated population times desired average QofL score at end of the year being budgeted. For example, 36,000,000 people x 3.5.
- Subtract the present value from the desired end value, and multiply by the dollar/QofL standard $1000. For example, 14,000,000 x $1000 = $14 trillion.
- Print that amount of money.
Results:
- Local exchange (for the group): this will stabilize the $ available for the budgeted year.
- International exchange (between groups): this will make the QofL goals visible and, through the
money value index, the standard interchangeable with the standards for other groups.
Exchange rate
There are two sides to this economic model (to all economic models, actually). Having two sides motivates competition (which helps improve our economic processes), and enables societies to exchange resources:
- Us (local exchange): Measure individual activities vs QofL units. Individuals can discover where they can fit into the group goals. Everyone is aware of what activities and resources exist and are being worked on. People can then contribute to the success of positive QofL activities and impede negative QofL activities proactively, based on individual abilities, availability, and energy.
- Compared to them (international exchange): From a group governance perspective, average out collective QofL calculations and budgeting to allow a group to establish a set QofL-and-dollar-based economic standard relative to other groups. This will clarify the economic value of one society vs that of another society - all based on the ability of a society to progress towards their and other societies' quality of life.
Considerations
Activities with a positive QofL index will be considered better investments and will attract more investors.
People and businesses (board of directors) that meet QofL increase predictions will be considered more reliable.
Activities that attract more investment will also have more money to spend on acquiring the resources they need.
Example
To give some values to play with:
- Fiscal period = 1 calendar year.
- Population in group/area = 10,000,000 individuals.
- Monetary standard = the dollar ($), with current value as expressed in the money value index.
- By the end of the past fiscal period, the society had issued $10,000 per individual, which, for a society of 10,000,000 individuals is $100,000,000,000.
- Average QofL score for group (
AQG): An initial analysis of the needs of a society results in a QofL index of 3, meaning that everyone, on average, is somewhat better than halfway happy about their life or, in other words, each person's needs, on average, are about 60% met.
- Planned change in group QofL score for the upcoming (current) fiscal period: At the start of a fiscal period, the planned projects' QofL index (= planned change in AQG) totalled for all planned projects is 1.5, meaning that the society is planning (considers itself able) to improve its QofL score (AQG) from 3 to 4.5.
AQG = 3 + 1.5 = 4.5
QofL index = 1.5
- Group-averaged resource requirements index: The individual resource index for each planned project averaged over all planned projects results in 4.7, which means that the planned projects have a 94% chance of acquiring the resources they need to fulfill their objectives.
resource requirements index = 4.7
- Success index for the past 10 years: e.g., at the end of the last fiscal period, the actual projects' QofL index increase was 1.25 vs 1.30 planned. The success index for that year, therefore, was 1.25/1.30 = 0.96. Doing the same calculation for the 9 other previous years gives a 10-year average success index of 0.98. Because last year's index is less than that average, the implication is that, last year, the society was less proficient than previous years.
- Performance index =
(1.5 (QofL) + 4.7 (resource) + 1.2 (success) + 0.9 (trend)) / 12 = 0.692
- Because the group did not meet planned-for QofL goals, increase the value of the monetary standard units by reducing the quantity of those units available as currency by:
(1 - 0.692) x $100,000,000,000 = $3,080,000,000
- The society would destroy $3,080,000,000 from the current amount of dollars in circulation.
- This increase will likely reduce the cost of each item and services by about 3.08% on the cost of items and services. This would increase the value of the group monetary standard relative by about 6% relative to outside groups. Outside groups will then be more interested in investing (selling resource to) this group, and those resources would cost the group fewer $ to buy.
- Apply the adjustments to the money value index to reflect the change in item/service costs in a way in which enables each individual, and the society as a whole, to assess the impact of this adjustment on their personal lives.
- As required, reduce the needs expectations, and adjust the activities and change or eliminate projects so that the resource requirements average (ARP averaged over all projects) approaches the ideal of 5.
Acknowledgements
This page, and the other 4 associated pages contain graphics that have been taken directly from pictures posted on the Internet. I thank those who have originated the pictures and assure them that as soon as I am able, I will drawn my own images and remove theirs from my site.
This page is written by myself, Peter Vasdi; this page first published and posted on the Internet on Sunday 25 October 2011.